Sales leaders love big numbers: 10,000 contacts added, 500 emails sent, 50 demos booked. But when pipeline quality is poor, those numbers become vanity metrics that mask a revenue problem. Lead quality matters more than quantity in B2B sales because every unqualified lead consumes rep time, inflates forecasts, and diverts resources from deals you can actually win. This guide explains why the quality-over-quantity shift is not optional in 2026—and how to execute it.
The volume trap is seductive. More leads feel like more opportunity. But B2B sales is a finite-attention game: every hour on a bad lead is an hour not spent on a good one. Teams that prioritize lead quality consistently outperform high-volume teams on revenue per rep, win rate, and forecast accuracy.
You will learn the true cost of low-quality leads, why volume metrics destroy sales performance, a framework for measuring and improving lead quality, and how to restructure your prospecting workflow around fit-first principles.
For related context, see lead qualification process, how sales teams find qualified leads, and how AI qualifies B2B leads automatically.
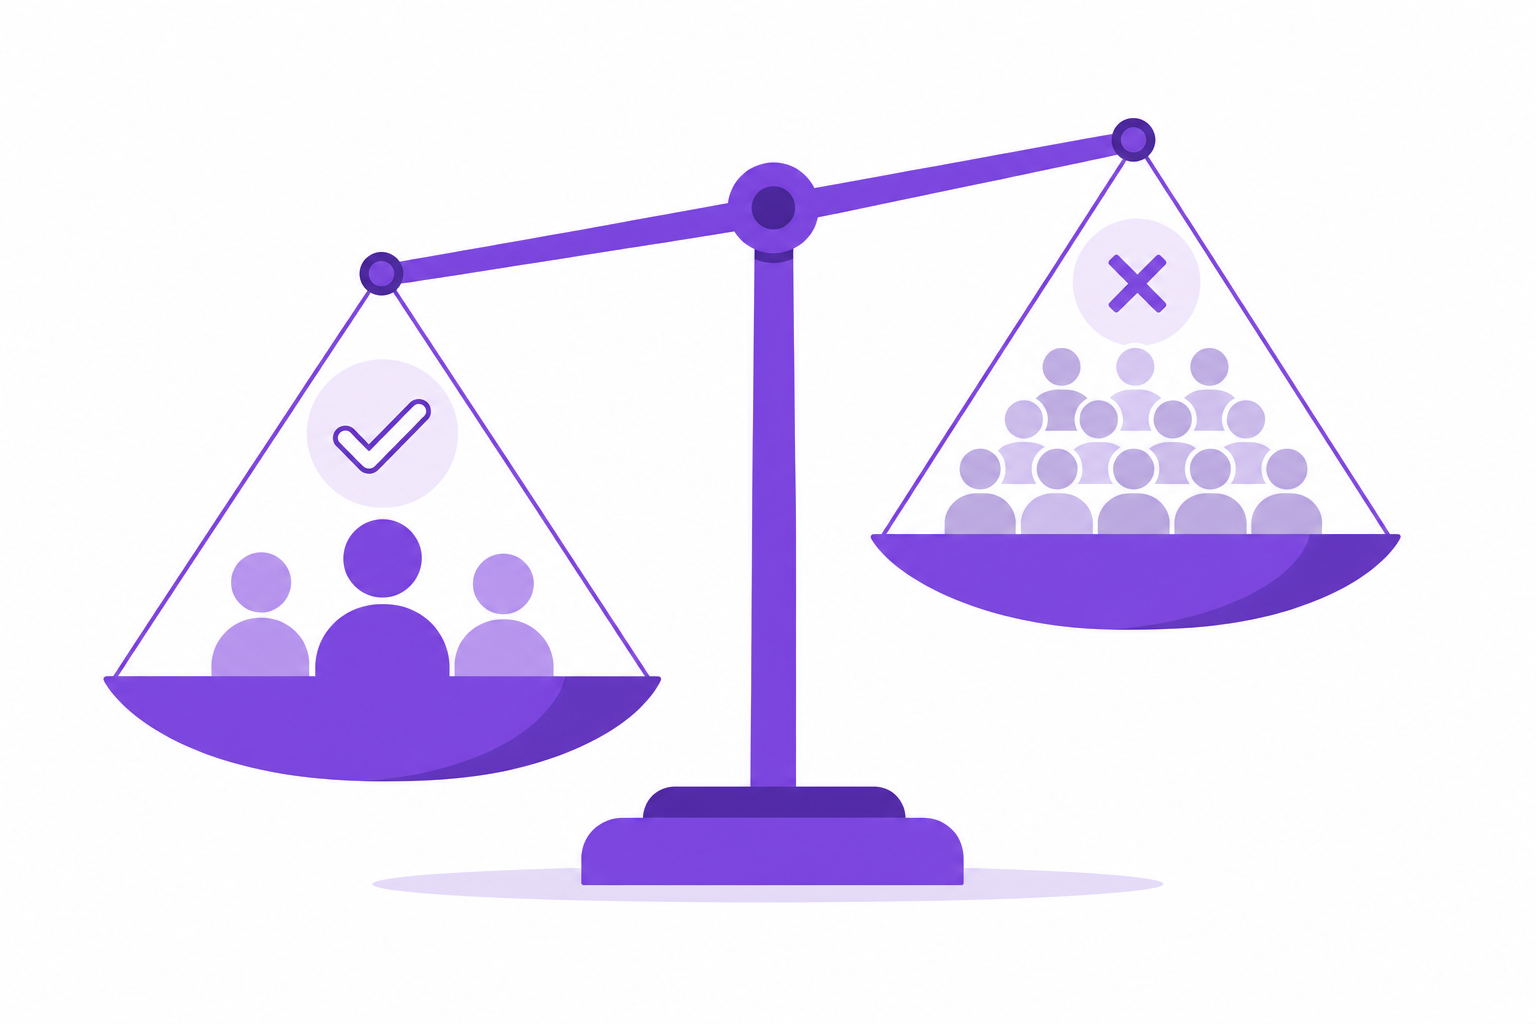
The Volume Illusion: Why More Leads Do Not Mean More Revenue
Sales organizations addicted to volume share a pattern: activity metrics look strong, pipeline looks full, but revenue misses target quarter after quarter. The disconnect is lead quality.
Volume-driven prospecting creates an illusion of progress:
- CRM contact count grows 20% quarterly—but pipeline value grows 5%
- SDRs hit email quotas—but reply rates decline
- Demo calendar is full—but show rates and conversion rates drop
- Forecast calls sound confident—but deals stall in late stages
- Win rate decreases as pipeline volume increases
More leads without quality filters do not create more revenue. They create more work—and more false confidence in forecasts that will not materialize.
What Lead Quality Means in B2B Sales
Lead quality is the degree to which a prospect matches the criteria that predict a successful deal. High-quality leads share characteristics:
- Firmographic fit: Company matches ICP on industry, size, geography, and use case
- Role relevance: Contact has decision authority or champion influence
- Pain alignment: Identifiable problem your solution addresses
- Timing signal: Reason to engage now—not indefinite future interest
- Data accuracy: Verified contact and company information
Low-quality leads fail on one or more dimensions. A perfect-fit company with no reachable decision-maker is low quality. A responsive contact at a non-ICP company is low quality. Interest without fit is low quality.
Define quality criteria with ICP identification guide and lead qualification process.
The True Cost of Low-Quality Leads
Bad leads are not free. They carry hidden costs that compound across your revenue organization.
SDR Time Cost
Every outreach touch on an unqualified lead—email, call, LinkedIn message—consumes 5–15 minutes including research and follow-up. At 200 low-quality contacts per week, that is 16–50 hours of wasted SDR capacity monthly.
AE Time Cost
When SDRs book meetings with wrong-fit accounts, AEs spend 30–60 minutes per discovery call that will never convert. At 10 bad meetings per month per AE, that is 5–10 hours of senior sales time destroyed.
Pipeline Pollution Cost
Low-quality leads inflate pipeline reports. Leadership makes hiring, spending, and strategy decisions based on opportunities that will never close. The cost is not just wasted time—it is misallocated resources across the business.
Domain and Brand Cost
High-volume outreach to unqualified contacts increases spam complaints, bounce rates, and negative brand perception. Recovery from domain reputation damage takes months.
Churn and Retention Cost
Customers acquired outside ICP churn faster. A "win" with a bad-fit customer creates support burden, low NPS, and no expansion revenue—often costing more than the initial contract value.
Strategy tip: Calculate your real cost per lead
Cost per lead = (SDR salary + tool costs + AE time on bad meetings) ÷ qualified leads that reach opportunity stage. Most teams discover their true cost per lead is 3–5x higher than the number on their dashboard—because unqualified leads are counted in the denominator.
Quality vs. Quantity: Side-by-Side Comparison
| Dimension | Quantity-focused team | Quality-focused team |
|---|---|---|
| Primary metric | Contacts added, emails sent | Pipeline created, SQL conversion |
| Prospecting approach | Broad database exports | ICP-scored, tiered lead lists |
| Reply rate | 1–3% | 5–15% |
| AE acceptance rate | 50–60% | 80–90% |
| Win rate | 10–15% | 25–35% |
| Sales cycle | Longer (bad-fit deals stall) | Shorter (fit drives urgency) |
| Revenue per rep | Below quota | At or above quota |
Why Sales Teams Default to Quantity
If quality is clearly better, why do so many teams optimize for volume? Understanding the traps helps you escape them.
- Activity metrics are easy to measure—counting emails is simpler than scoring fit
- Volume feels productive—reps and managers see visible output daily
- Tool vendors sell volume—databases price per contact, incentivizing large exports
- Fear of pipeline gaps—leaders worry fewer leads means fewer opportunities
- No ICP discipline—without clear targeting criteria, everything looks like a lead
- Lagging quality metrics—win rate and churn show up months after bad targeting decisions
Breaking the quantity habit requires leadership commitment to outcome metrics and a qualification system that makes quality visible before outreach begins.
The Lead Quality Scoring Framework
Make quality measurable with a scoring model applied before any outreach:
Fit Score (0–50 points)
- Industry match to ICP primary vertical: +15
- Company size within ICP range: +10
- Geography in target market: +10
- Technographic or operational match: +10
- Known buying trigger present: +5
Contact Score (0–30 points)
- Decision-maker or economic buyer role: +15
- Champion or strong influencer role: +10
- Verified email and current employment: +5
Receptivity Score (0–20 points)
- Recent company growth or expansion signal: +10
- Leadership change or hiring in relevant department: +5
- Content engagement or intent signal: +5
Tier Thresholds
- Tier A (70+): Immediate outreach, senior SDR or AE involvement
- Tier B (50–69): Standard outreach sequence
- Tier C (below 50): Nurture, monitor, or exclude
Automate scoring with AI lead qualification and AI ICP tools.
7 Steps to Shift from Quantity to Quality
- Audit current lead quality: Score your last 200 contacts against ICP criteria. Calculate what percentage are Tier A/B.
- Document ICP with disqualifiers: Not just who to target—who to exclude. See ICP identification guide.
- Implement pre-outreach scoring: No contact enters a sequence without a fit score. Manual or automated.
- Reduce list size by 50%: Cut the bottom half of your current list. Reallocate saved time to Tier A outreach.
- Change SDR metrics: Replace contacts-added with pipeline-created and SQL conversion rate.
- Track quality metrics weekly: Tier distribution, AE acceptance rate, win rate by tier.
- Close the feedback loop: Feed win/loss data back into ICP and scoring criteria quarterly.
Strategy tip: The 100-lead challenge
Challenge your SDR team: produce 100 Tier A leads in two weeks—not 1,000 unqualified contacts. Most teams discover that 100 well-qualified leads generate more pipeline than 1,000 spray-and-pray contacts. Quality is not a constraint—it is an accelerator.
How Lead Quality Impacts Every Stage of the Funnel
Quality is not just a prospecting concern. It compounds—or erodes—at every funnel stage:
- Prospecting: Higher reply rates, fewer bounces, better domain reputation
- Discovery: Shorter calls because pain is real and relevant
- Demo: Higher show rates because prospects self-selected through fit
- Proposal: Fewer stalls because budget and authority were confirmed early
- Close: Higher win rates because the deal was winnable from day one
- Retention: Lower churn because customers actually fit the product
- Expansion: Upsell potential because ICP-fit customers grow with you
One quality decision at the top of the funnel prevents ten problems downstream. Read how sales teams find qualified leads for sourcing strategies that prioritize fit.
Quality Metrics Dashboard: What to Track
- ICP-fit rate: Percentage of new contacts that score Tier A or B
- Lead-to-SQL conversion: By tier—Tier A should convert 3–5x higher than Tier C
- SQL acceptance rate: AE acceptance above 80% indicates quality handoffs
- Win rate by lead tier: Validates scoring model accuracy
- Sales cycle length by tier: Tier A should close faster
- Customer churn by acquisition source: Reveals which sources produce lasting customers
- Revenue per lead: Total revenue ÷ leads that reached opportunity stage
How AI Makes Lead Quality Scalable
The traditional objection to quality-first prospecting is scale: "We cannot manually score every lead." That was true in 2020. In 2026, AI qualifies leads at scale before humans touch them.
- ICP fit scoring across thousands of accounts in minutes
- Decision-maker identification with role relevance
- Receptivity signals from company events and behavior
- Automatic tiering into A/B/C lists for prioritized outreach
- Continuous re-scoring as new data emerges
AI does not replace sales judgment on discovery calls. It ensures human time is spent on leads worth qualifying. Compare approaches in AI prospecting vs manual prospecting.
How Adsaga.ai Delivers Quality-First Lead Generation
Adsaga.ai is built for teams that prioritize lead quality over lead volume. Every workflow starts with ICP definition and returns tiered, scored leads—so reps never wade through unqualified exports.
Adsaga.ai workflow at a glance
Create Config (plain language ICP, Auto-fill structures criteria) → Run Workflow (AI discovers and scores accounts) → View Tiered Leads (Tier A/B with ICP fit + receptivity scores) → focus outreach on highest-quality prospects
Step 1: Create Config
Define your ideal customer in plain language—industries, company size, geography, buyer roles, and disqualifiers. Auto-fill translates your description into structured ICP criteria that drive quality-focused discovery.
Step 2: Run Workflow
AI discovers companies matching your ICP, identifies decision-makers, and scores each account on fit and receptivity. Quality assessment happens automatically—before any SDR time is invested.
Step 3: View Tiered Leads
Tier A leads (highest ICP fit and receptivity) are ready for immediate outreach. Tier B leads enter standard sequences. Low-scoring accounts never pollute your pipeline. Export quality-tiered lists to CRM or outreach tools.
Common Objections to Quality-First Prospecting
"We need volume to hit pipeline targets"
Pipeline targets based on volume assumptions are the problem. Recalculate: if your win rate doubles with quality leads, you need half the pipeline to hit the same revenue. Quality increases conversion at every stage.
"Our SDRs will have nothing to do with smaller lists"
Smaller, higher-quality lists free SDR time for personalization, follow-up, and multi-threading—activities that convert, not activities that fill spreadsheets.
"We cannot score leads manually at scale"
Correct—which is why AI scoring exists. Automated ICP fit and receptivity scoring makes quality scalable without proportional headcount increases.
Frequently Asked Questions
Why does lead quality matter more than quantity in B2B sales?
Every unqualified lead consumes rep time, inflates pipeline forecasts, and diverts resources from winnable deals. Quality-focused teams achieve higher reply rates, win rates, and revenue per rep—while working fewer total contacts.
How do you measure lead quality?
Score leads on ICP fit (firmographics, industry, size), contact relevance (decision-maker access), and receptivity (timing signals). Tier leads as A/B/C and track conversion rates, win rates, and churn by tier to validate your model.
What is a good lead-to-opportunity conversion rate?
For Tier A ICP-fit leads, 15–25% lead-to-opportunity conversion is healthy. If your overall rate is below 5%, lead quality—not sales skill—is the bottleneck.
How does AI improve lead quality at scale?
AI scores ICP fit and receptivity across large account sets automatically, tiers leads for prioritized outreach, and identifies decision-makers—making quality-first prospecting scalable without manual scoring bottlenecks.
Should we reduce our prospecting list size?
Yes—cut unqualified contacts and reallocate time to Tier A outreach. Most teams see improved reply rates, meeting bookings, and pipeline quality within 30 days of reducing list size while increasing fit standards.
Final Thoughts
The era of volume-based B2B prospecting is over. Buyers ignore generic outreach. Domains get blacklisted from high-bounce campaigns. AEs burn out on discovery calls that never close. The teams winning in 2026 are not sending more emails—they are sending better-targeted emails to fewer, higher-quality leads.
Measure quality. Score before outreach. Tier your lists. Track conversion by tier. Let the data prove what your best reps already know: ten perfect-fit leads beat a thousand maybes.
Ready to prioritize lead quality? Get started with Adsaga.ai and build tiered, ICP-scored lead lists that convert.